TOPIC: MATTER
SUBTOPIC: Heating and Cooling Curves of Matter
SPECIFIC COMPETENCES:
1. Construct the heating and cooling curves of matter
2. Interpret heating and cooling curves
INTRODUCTION
All matter around us exists in different states: solid, liquid, and gas. These states are not fixed and can change when matter gains or loses energy, usually in the form of heat. Understanding how matter responds to changes in temperature and energy is crucial in chemistry. This unit will explore the relationship between heat, temperature, and the physical states of matter by examining heating and cooling curves. These curves provide a visual representation of the energy changes involved during phase transitions.
CORE CONCEPTS
THE PARTICULATE NATURE OF MATTER AND ENERGY
Matter is made up of tiny particles (atoms, molecules, or ions) that are in constant motion. This is known as the kinetic theory of matter. The amount of energy these particles possess determines their state and how they behave.
• Kinetic Energy: This is the energy an object possesses due to its motion. In matter, particles are constantly moving, vibrating, rotating, and translating. Temperature is a measure of the average kinetic energy of the particles in a substance. When a substance is heated, its particles gain kinetic energy and move faster, leading to an increase in temperature.
• Potential Energy: This is stored energy due to the position or arrangement of particles. In matter, potential energy is associated with the forces of attraction between particles. During a change of state (e.g., melting or boiling), the particles absorb energy not to increase their speed (kinetic energy), but to overcome the intermolecular forces holding them together. This energy is stored as potential energy, and the temperature of the substance remains constant.
When heat energy is supplied to a substance:
1. Initially, the particles gain kinetic energy, causing the temperature to rise.
2. At certain points, the energy absorbed is used to overcome the forces of attraction between particles, leading to a change of state. During these phase changes, the potential energy of the particles increases, but their average kinetic energy (and thus temperature) remains constant.
When heat energy is removed from a substance:
1. Initially, the particles lose kinetic energy, causing the temperature to fall.
2. At certain points, the particles release energy as they form stronger bonds with each other, leading to a change of state. During these phase changes, the potential energy of the particles decreases, but their average kinetic energy (and thus temperature) remains constant.
HEATING CURVES OF MATTER
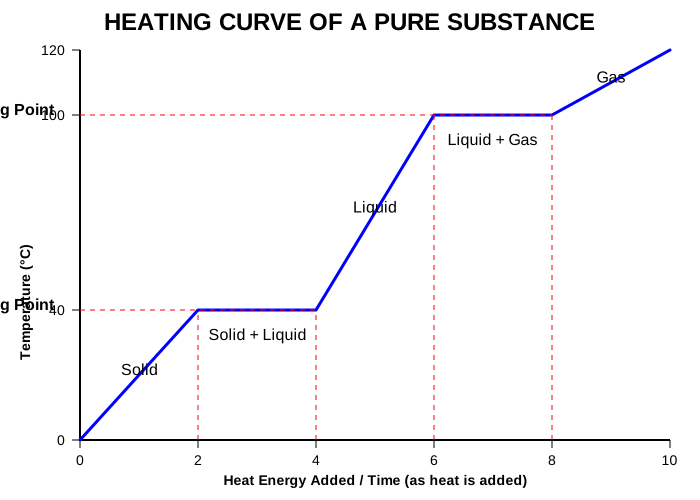
A heating curve is a graph that plots the temperature of a substance against the heat energy supplied or time (assuming a constant rate of heating). It shows how the temperature of a substance changes as it absorbs heat and undergoes phase transitions.
Consider the heating of a solid substance:
1. Solid Phase (Section A-B): As heat is supplied to the solid, the particles gain kinetic energy and vibrate more vigorously. The temperature of the solid steadily increases.
2. Melting Phase (Section B-C): At a specific temperature, the solid begins to turn into a liquid. This temperature is called the melting point. During melting, the particles absorb energy (called latent heat of fusion) to overcome the strong forces holding them in fixed positions. The absorbed energy increases the potential energy of the particles, allowing them to move more freely. Crucially, the temperature remains constant during this phase change, even though heat is still being supplied.
3. Liquid Phase (Section C-D): Once all the solid has melted into liquid, further heating causes the liquid particles to gain kinetic energy and move faster. The temperature of the liquid steadily increases.
4. Boiling Phase (Section D-E): At another specific temperature, the liquid begins to turn into a gas. This temperature is called the boiling point. During boiling, the particles absorb a large amount of energy (called latent heat of vaporisation) to completely overcome the intermolecular forces and escape into the gaseous state. The absorbed energy increases the potential energy of the particles. The temperature remains constant during this phase change.
5. Gas Phase (Section E-F): Once all the liquid has turned into gas, further heating causes the gas particles to gain kinetic energy and move even faster. The temperature of the gas steadily increases.
 |
HEATING CURVE OF A PURE SUBSTANCE |
Figure: A typical heating curve for a pure substance, illustrating temperature changes and phase transitions.
Worked Example: Interpreting a Heating Curve
A student heats a pure substance at a constant rate and records the temperature over time. The heating curve shows that the substance starts melting at 50°C and starts boiling at 120°C.
Solution
| Given: |
Melting point = 50°C | Boiling point = 120°C |
| Find: |
a) State of matter at 30°C
b) State of matter at 80°C
c) What happens to the energy supplied between 50°C and 120°C?
|
| Analysis: |
- Below melting point (50°C), substance is solid.
- Between melting point (50°C) and boiling point (120°C), substance is liquid.
- Above boiling point (120°C), substance is gas.
- During phase changes, temperature is constant.
|
| Answer: |
a) At 30°C, the substance is in the solid state.
b) At 80°C, the substance is in the liquid state.
c) Between 50°C and 120°C, the substance is in the liquid phase. The energy supplied increases the kinetic energy of the particles, causing the temperature of the liquid to rise.
|
Worked Example: Interpreting states of matter from a heating curve.
✅ Check Your Understanding
Pause here. Let learners attempt these before moving on.
| 1. Quick Recall [1 mark] |
What term describes the energy absorbed by a substance during melting without a change in temperature? |
| 2. Apply the Concept [3 marks] |
A pure substance has a melting point of 25°C and a boiling point of 110°C. Describe the state(s) of matter present when the substance is heated to 110°C. Explain your answer. |
| 3. Misconception Check |
True or False: During the boiling phase of a heating curve, the temperature of the substance continues to rise rapidly because the particles are gaining a lot of kinetic energy. Justify your answer. |
Answers
1. Latent heat of fusion.
2. At 110°C, the substance is at its boiling point, so both liquid and gas states will be present simultaneously. The energy supplied is being used to overcome intermolecular forces to change liquid into gas, keeping the temperature constant until all liquid has vaporised.
3. False. During the boiling phase, the temperature remains constant. The energy supplied is used to overcome the intermolecular forces between liquid particles to turn them into gas (increasing potential energy), not to increase the kinetic energy of the particles.
COOLING CURVES OF MATTER
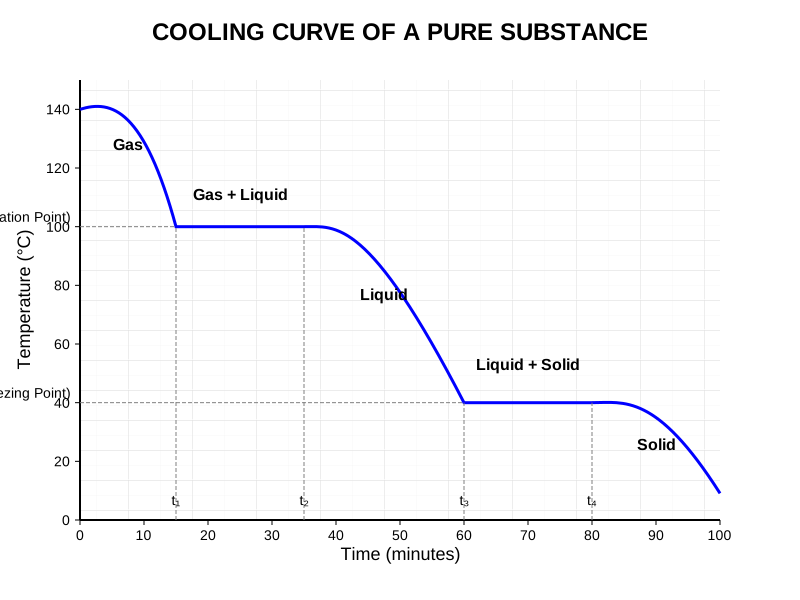
A cooling curve is a graph that plots the temperature of a substance against the heat energy removed or time (assuming a constant rate of cooling). It shows how the temperature of a substance changes as it loses heat and undergoes phase transitions. Cooling curves are essentially the reverse of heating curves.
Consider the cooling of a gaseous substance:
1. Gas Phase (Section F-E): As heat is removed from the gas, its particles lose kinetic energy and slow down. The temperature of the gas steadily decreases.
2. Condensation Phase (Section E-D): At a specific temperature, the gas begins to turn into a liquid. This temperature is called the condensation point. During condensation, the particles release energy (latent heat of vaporisation) as they form intermolecular forces to become a liquid. This released energy decreases the potential energy of the particles. The temperature remains constant during this phase change, even though heat is still being removed.
3. Liquid Phase (Section D-C): Once all the gas has condensed into liquid, further cooling causes the liquid particles to lose kinetic energy and slow down. The temperature of the liquid steadily decreases.
4. Freezing Phase (Section C-B): At another specific temperature, the liquid begins to turn into a solid. This temperature is called the freezing point. During freezing, the particles release energy (latent heat of fusion) as they arrange into a more ordered solid structure. This released energy decreases the potential energy of the particles. The temperature remains constant during this phase change.
5. Solid Phase (Section B-A): Once all the liquid has frozen into solid, further cooling causes the solid particles to lose kinetic energy and vibrate less. The temperature of the solid steadily decreases.
 |
COOLING CURVE OF A PURE SUBSTANCE |
Figure: A typical cooling curve for a pure substance, illustrating temperature changes and phase transitions.
Worked Example: Interpreting a Cooling Curve
A substance is cooled from a gaseous state at a constant rate. Its cooling curve shows that it condenses at 80°C and freezes at 15°C.
Solution
| Given: |
Condensation point = 80°C | Freezing point = 15°C |
| Find: |
a) State of matter at 90°C
b) State of matter at 40°C
c) What happens to the energy of the particles between 15°C and 80°C?
|
| Analysis: |
- Above condensation point (80°C), substance is gas.
- Between freezing point (15°C) and condensation point (80°C), substance is liquid.
- Below freezing point (15°C), substance is solid.
- During phase changes, temperature is constant.
|
| Answer: |
a) At 90°C, the substance is in the gaseous state.
b) At 40°C, the substance is in the liquid state.
c) Between 15°C and 80°C, the substance is in the liquid phase. The energy of the particles decreases as heat is removed, causing the temperature of the liquid to fall.
|
Worked Example: Interpreting states of matter from a cooling curve.
✅ Check Your Understanding
Pause here. Let learners attempt these before moving on.
| 1. Quick Recall [1 mark] |
What is the name given to the temperature at which a liquid turns into a solid? |
| 2. Apply the Concept [3 marks] |
A substance is known to have a boiling point of 100°C and a freezing point of 0°C. If this substance is cooled from 120°C to -10°C, at what temperature(s) will its potential energy decrease significantly without a change in kinetic energy? |
| 3. Misconception Check |
True or False: The condensation point of a substance is always lower than its boiling point. Justify your answer. |
Answers
1. Freezing point.
2. The potential energy will decrease significantly without a change in kinetic energy at 100°C (during condensation from gas to liquid) and at 0°C (during freezing from liquid to solid). At these points, phase changes occur, where heat is released to form stronger bonds, reducing potential energy while temperature (kinetic energy) remains constant.
3. False. For a pure substance, the condensation point is the same temperature as its boiling point. They represent the same phase transition (liquid-gas equilibrium) but in opposite directions (gas to liquid vs. liquid to gas).
COMPARING HEATING AND COOLING CURVES
For a pure substance, the heating and cooling curves are essentially inverse processes.
• Melting Point vs. Freezing Point: For a pure substance, the melting point is exactly the same as its freezing point. For example, water melts at 0°C and freezes at 0°C.
• Boiling Point vs. Condensation Point: Similarly, the boiling point of a pure substance is the same as its condensation point. For example, water boils at 100°C and steam condenses at 100°C.
• Energy Changes: During heating, energy is absorbed (endothermic process) to increase particle kinetic energy or overcome intermolecular forces. During cooling, energy is released (exothermic process) as particles lose kinetic energy or form stronger intermolecular forces.
• Impure Substances: The heating and cooling curves for impure substances (mixtures) differ from those of pure substances. Impure substances typically melt and boil over a range of temperatures, rather than at a single, sharp melting or boiling point. This is because impurities disrupt the regular arrangement of particles and weaken the intermolecular forces, requiring different amounts of energy for different parts of the mixture to change state.
✅ Check Your Understanding
Pause here. Let learners attempt these before moving on.
| 1. Quick Recall [1 mark] |
For a pure substance, how does its melting point compare to its freezing point? |
| 2. Apply the Concept [2 marks] |
A substance has a boiling point of 78°C. What would be its condensation point? |
| 3. Misconception Check |
A student states: "The flat sections on a heating curve mean that no heat is being supplied to the substance at those points." Is this statement correct? Explain why. |
Answers
1. For a pure substance, the melting point is the same as its freezing point.
2. The condensation point of the substance would also be 78°C, as boiling and condensation occur at the same temperature for a pure substance.
3. No, this statement is incorrect. Heat is continuously being supplied during the flat sections of a heating curve. However, this energy is used to overcome the intermolecular forces during a phase change (e.g., melting or boiling), rather than increasing the kinetic energy of the particles, which means the temperature remains constant.
SUMMARY
Heating and cooling curves illustrate the relationship between temperature, heat energy, and the physical states of matter. They show that as a substance gains or loses heat, its temperature changes, except during phase transitions (melting/freezing and boiling/condensation). During these transitions, the absorbed or released energy is used to change the potential energy of the particles, allowing them to overcome or form intermolecular forces, while the temperature remains constant. For pure substances, melting point equals freezing point, and boiling point equals condensation point.
ASSESSMENT QUESTIONS
1. Define the terms 'melting point' and 'boiling point' as observed on a heating curve. [2 marks]
2. Sketch a labelled heating curve for a pure substance, clearly indicating the solid, liquid, and gaseous states, as well as the melting and boiling points. [5 marks]
3. Explain, in terms of particle energy, why the temperature of a substance remains constant during melting, even though heat is continuously being supplied. [3 marks]
4. A substance has a freezing point of -5°C and a boiling point of 70°C.
a) What is its melting point? [1 mark]
b) What is its condensation point? [1 mark]
c) Describe the state(s) of matter of this substance at 50°C. [2 marks]
5. State two differences between the heating curve of a pure substance and that of an impure substance. [2 marks]
COMMON DIFFICULTIES & MISCONCEPTIONS
• Confusing Temperature Change with Phase Change: Learners often assume that if heat is being supplied, the temperature must always rise. They struggle with the concept that temperature remains constant during phase changes because the energy is being used to change potential energy, not kinetic energy.
• Particles Stop Moving: Some learners believe that particles in solids are stationary. It's important to reinforce that particles in solids still vibrate in fixed positions.
• Melting/Freezing Points Differ: Learners may think that the temperature at which a substance melts is different from the temperature at which it freezes. Emphasise that for a pure substance, these are the same.
• Impure Substances: Learners might expect all substances to have sharp melting and boiling points, not understanding that impurities cause a range of temperatures for phase changes.
• Energy Loss during Cooling: Learners sometimes forget that energy is released during cooling and phase changes like condensation and freezing.
QUICK REFERENCE SUMMARY
Key Terms and Concepts: Heating and Cooling Curves
| Heating Curve |
Graph of temperature vs. heat supplied (or time) showing phase changes. |
| Cooling Curve |
Graph of temperature vs. heat removed (or time) showing phase changes. |
| Melting Point |
Temperature at which a solid turns into a liquid. |
| Boiling Point |
Temperature at which a liquid turns into a gas. |
| Freezing Point |
Temperature at which a liquid turns into a solid. (Same as melting point for pure substances) |
| Condensation Point |
Temperature at which a gas turns into a liquid. (Same as boiling point for pure substances) |
| Latent Heat |
Energy absorbed/released during a phase change without temperature change. |
Figure: Summary of key terms related to heating and cooling curves.